

In this article · 6 sections
A familiar afternoon: the town forecast looks manageable, and the sideline WBGT monitor crosses 87.0 an hour before anyone expected. In Georgia and in Texas Class 3, 87.0 is where practice is capped at two hours and the pads come off. Nothing is broken. The two numbers are measuring different things, in different places.
The town number is usually a different number
Start with what the town forecast is. The figure on the evening news or in a phone app is usually the air temperature and the heat index, and the official observations behind it come largely from automated stations that the National Weather Service describes as primarily located at airports. The heat index combines only temperature and humidity, and the NWS is explicit that it assumes you are in the shade.
WBGT is built differently. Outdoors it is 70% natural wet-bulb temperature, 20% black globe temperature and 10% air temperature, and it is taken in direct sun. It responds to wind, sun angle and cloud cover as well as heat and humidity. So the question is not why the field disagrees with the airport; it is which of those extra inputs is different on your field. Usually it is one of three.
- 70%natural wet-bulb: humidity and wind
- 20%black globe: sun and radiant heat
- 10%air temperature
1. Shade: the field has none
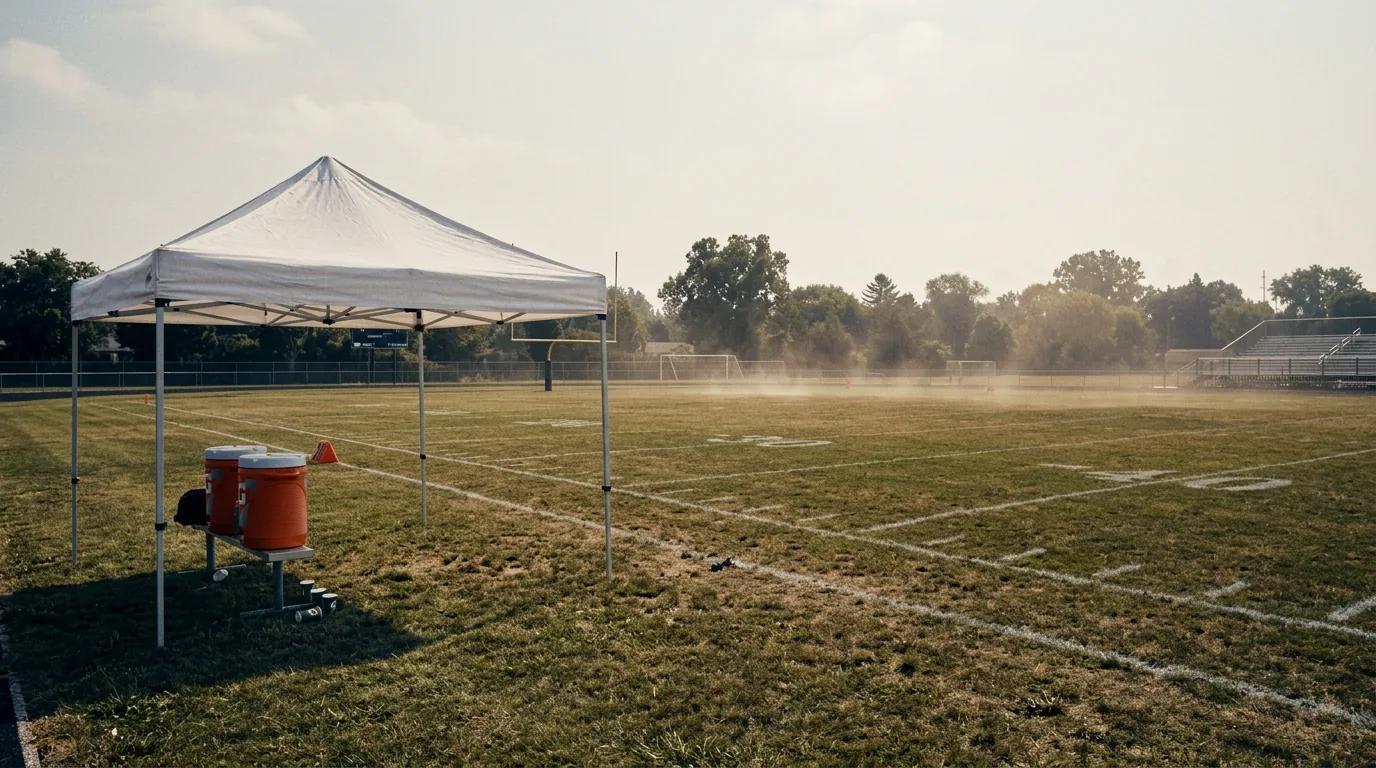
A practice field is chosen for being open, and that means full sun for most of the afternoon. The NWS notes that direct sunlight can add as much as 15 degrees to the heat index. WBGT captures that sun through the globe, which is why the rules insist the device sits where the athletes are: Florida’s FHSAA, for example, has it set up in the sun, three feet above the surface, not under shade. A reading taken from a shaded press box, or a forecast built for shade, will run behind the field.
2. The surface: the ground radiates heat back
The globe thermometer is a black sphere that measures radiant energy — OSHA's technical guidance describes it as reading heat from direct sunlight or other sources, such as hot structures nearby. On a field, the ground under the athletes is one of those sources.
Synthetic turf is the extreme case. Researchers at Penn State's Center for Sports Surface Research summarise earlier reports of traditional synthetic surfaces running 35–60 °C hotter than natural grass in sunlight, and of infill systems reaching 93 °C on a 37 °C day. Their own tests found irrigation could bring the surface down to the temperature of natural grass, but not for as long as a standard game or practice lasts.
Keep the scale honest: a surface temperature is not a WBGT. The globe carries 20% of the index, so a field that is tens of degrees hotter at ground level does not add tens of degrees to the reading. It adds some, on top of the sun, and on a day sitting just under a threshold, some is enough.
3. Wind: the airport usually has more of it
Wind cools the wet-bulb sensor, and the wet bulb carries 70% of the index. An airport is wide open; a practice field is often tucked behind a school building, a bank of bleachers or a tree line. OSHA notes that changes in wind speed can have a significant effect on WBGT, and the NWS gives a worked example: with temperature and humidity held the same, raising the wind from 3 to 13 mph took a WBGT of 89 down to 83, and more cloud cover lowered it further. Run that in reverse and a sheltered field on a still afternoon reads several degrees hotter than an open one nearby.
Full sun · little wind
The field reads hotter than the airport because it is a different place.
What to do about the gap
- Plan on WBGT, not on the heat index. Your association’s bands are WBGT bands; a heat index forecast does not map onto them.
- Put the device where the athletes are: in the sun, at the height your association sets, on the surface they actually practise on. If you have turf and grass fields, read the one in use.
- Use a forecast for your ground, not the airport’s. Flash forecasts WBGT hourly, six hours ahead, per 1×1 km cell, so the outlook is for your campus rather than a station miles away.
- Know what a cell cannot see. Two fields inside the same 1×1 km cell share one forecast; the bleachers that block the breeze on one of them do not show up in it. That difference is what the on-site reading is for.
- Compare the two over a few weeks. The Flash decision log keeps the sensor reading and the forecast side by side with timestamps. If one field consistently reads above the outlook, plan that field with a margin, and move its sessions earlier or later first.
The thresholds themselves come from your association, as printed: 87.0 starts the two-hour band in Georgia and in Texas Class 3, 84.7 in Texas Class 2, and 87.1 in Florida. The state heat policy pages carry each table as the association prints it.
Frequently asked
Town forecasts usually describe air temperature and heat index, which assumes shade, from stations mostly at airports. WBGT is taken in direct sun and rises with radiant heat from the surface and with less wind, so a sunny field sheltered from the wind often reads higher.
It can add some. Synthetic turf surfaces run far hotter than grass in sunlight, and the globe thermometer picks up radiant heat. But the globe is 20% of WBGT, so the reading rises much less than the surface temperature does.
Where the athletes are, in the sun, at the height your association sets — FHSAA, for example, sets it three feet above the surface and not under shade. OSHA guidance likewise says WBGT is most reliable measured at or near the work area.
No. The heat index uses temperature and humidity and assumes shade. WBGT adds the effects of sun, wind and cloud cover through its globe and wet-bulb readings.