Skip to content

TURF AGRONOMY · FROST AND HAIL METRICS FOR TURF

Frost, disease pressure and hail, on one screen

Turf decisions turn on conditions that change hourly. The agronomy suite puts them next to the hazard forecast.

lightning accuracy
Up to 99.6%
lead time
Up to 60 min
forecast cell
1×1 km
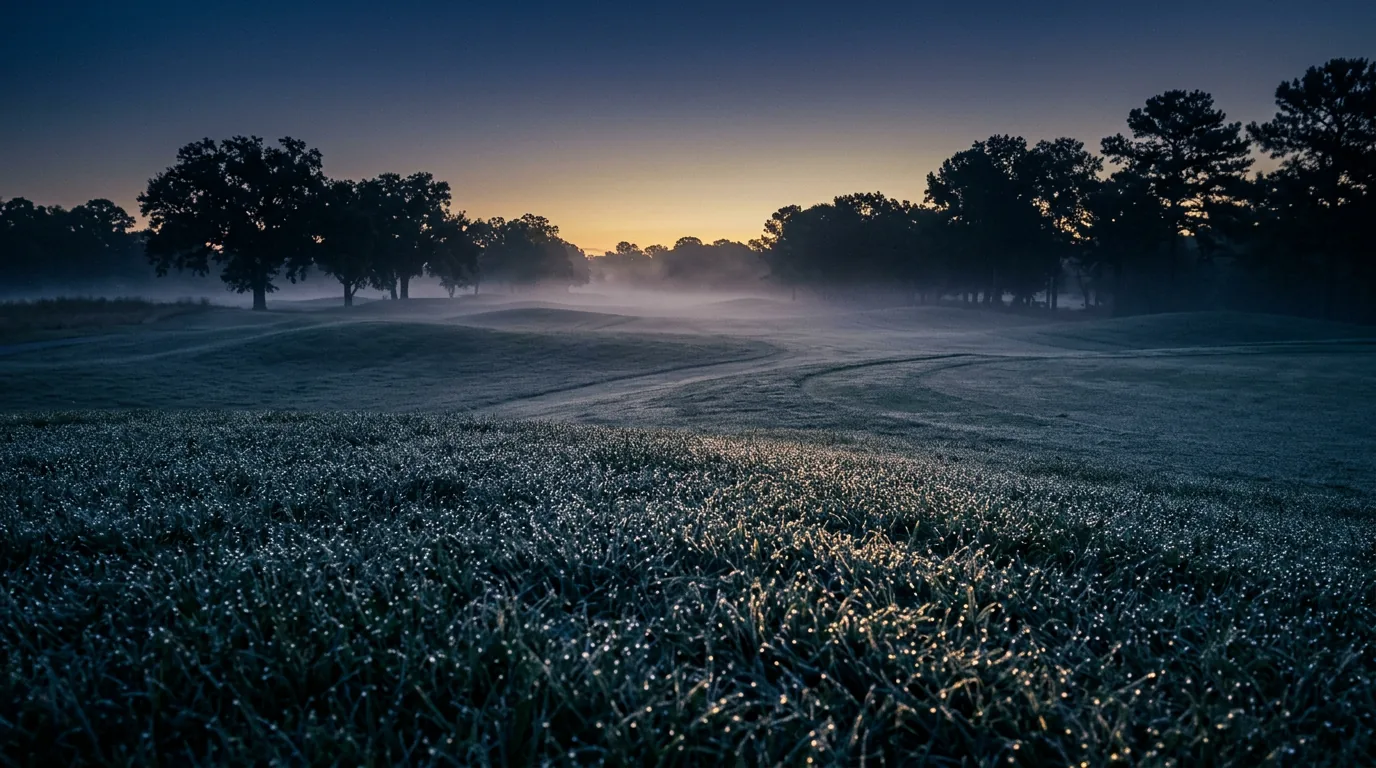
Dew on close-cut turf, the leaf wetness that drives disease pressure
Frost, disease pressure, hail · one screenIllustrative example · not live weather

Skye · ask in plain language

Ask the question your crew actually asks.

Pick your industry. Skye, Flash Weather's AI weather agent, answers from the same 1×1 km forecast, refreshed as often as every two minutes, then acts in the tools you already run.

SKYE can connect to your CRM and ERP.

Your tools and data

Sites, limits, schedules

CRM · ERP · Procore · Slack

Prediction engine

15+ forecasts, 1×1 km

Lightning every 2 min, hail every 5

Power
Skye, the Flash Weather agent

Skye

Combines both, answers in plain language, proposes the action.

You and your crew

Ask in plain language

Get the answer in seconds

Your decision

  • Go / No-go
  • Reschedule
  • Alert the crew
Pick your industry

Questions crews ask

Illustrative example · not live weather

Keep traffic off the field until the frost has gone

Frost damage is a budget line, not just a turf problem. Traffic on a frosted surface crushes the crown of the plant, and the damage does not show until the thaw. Repairing or resodding a field costs more than a season of forecasting it, and it takes the field out of use while you do.

  • By day

    Frost probability by day

    Banded from none to high, so a risky morning is visible days out and the crew is planned around it.

  • By hour

    A burnoff time, not just a low temperature

    You know the hour the surface is safe to use, so tee times and field access open on schedule rather than on a guess.

  • By corner

    Shaded frost tracked separately

    The corner that sits in shadow clears last, so it gets its own forecast instead of the sunny side’s.

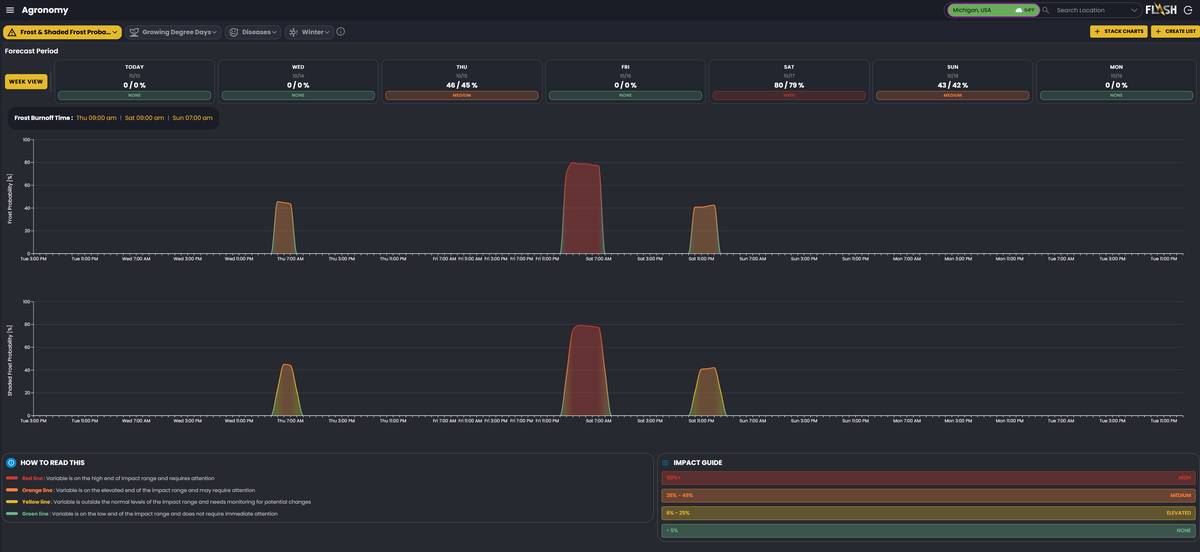
A week of frost, hour by hour, on your own fields

The Agronomy frost view in the Weather Command Center: frost probability by day with its band, the burnoff times, and the hourly frost and shaded-frost charts. Saturday is flagged high, and the frost clears at 9 AM.

  • High
  • Medium
  • Elevated
  • None
The Agronomy frost view in the Weather Command Center: a week of frost probability by day, burnoff times, and the hourly frost and shaded frost charts

ILLUSTRATIVE EXAMPLE · NOT LIVE WEATHER

A burnoff time, not just a low temperature

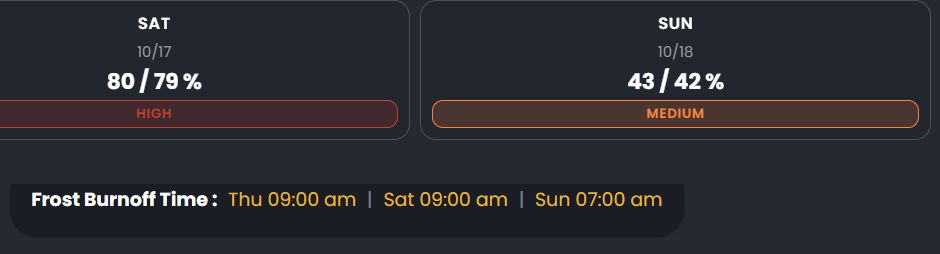
A closer look at the week strip. Saturday is flagged high at 80 percent, and the frost clears at 9 AM. You know the hour the surface is safe to use, so field access is set in the office rather than on the sideline.

  • High
  • Medium

Shaded frost is tracked separately, because the corner that sits in shadow clears last.

ILLUSTRATIVE EXAMPLE · NOT LIVE WEATHER

A closer look: Saturday at 80 percent frost probability, flagged high, with the burnoff times for the week

2 minrefresh cycle, on your own 1×1 km cells

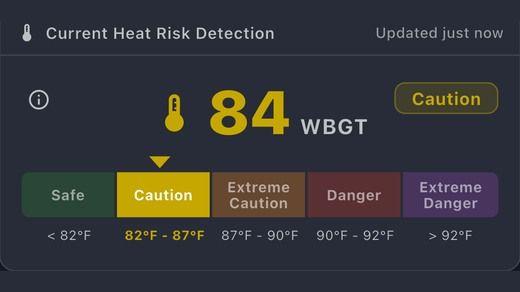
The Flash heat risk gauge reading 84 WBGT in the Caution band

Heat risk · 84 WBGT, Caution

Modeled on your fields, not the nearest airport

Prediction, not detection. Most providers tell you what the conditions are right now, at a station that is not your field. Flash forecasts before conditions arrive, at 1 km, on a 2-minute cycle, which is the difference between planning the morning and reacting to it. WBGT runs hour by hour and five days out on the same cells, so the heat call for the crew is made in the office too.

See the Agronomy Suite

Who brings Flash into turf agronomy, and why

The titles that make the call, the problem they describe on the first conversation, and where they gather.

Who buys

  • Golf course superintendent
  • Stadium grounds manager
  • Turf manager

The problem on the first call

  • Frost delays.
  • Spray and irrigation timing, from the ET rate.
  • Disease pressure.
  • Forecasts built for the nearest airport instead of their own property.

Customers we can name

Questions superintendents and stadium turf managers ask

Frost and disease-pressure metrics alongside lightning and hail, on the same sites.

Hanse Golf Design, for which Flash is the official lightning safety and agronomic provider, and Troon-managed courses.

Yes. Each frosty day carries a burnoff time, the hour the surface is safe to use, beside its frost probability band from none to high. Shaded frost is forecast separately, because the corner in shadow clears last.

Your fields. Frost and WBGT are modeled on your own 1×1 km cells and refreshed on a 2-minute cycle, not read from a station miles away.

Yes. Flash allows you to create and monitor multiple locations, making it easy to track conditions across fields, job sites, facilities, or service areas from a single platform.

Lightning refreshes every 2 minutes and hail every 5 minutes, so you are always working with the most current and actionable information available.

Flash gives you real-time rainfall and temperature data so you can adjust irrigation based on actual conditions rather than a fixed schedule.

Live demo · No sensors required for the forecast

See your own sites on the map before the next storm.

We'll load your locations, replay last season's strikes against Flash's predictions, and show you the alert log your safety officer would have received.